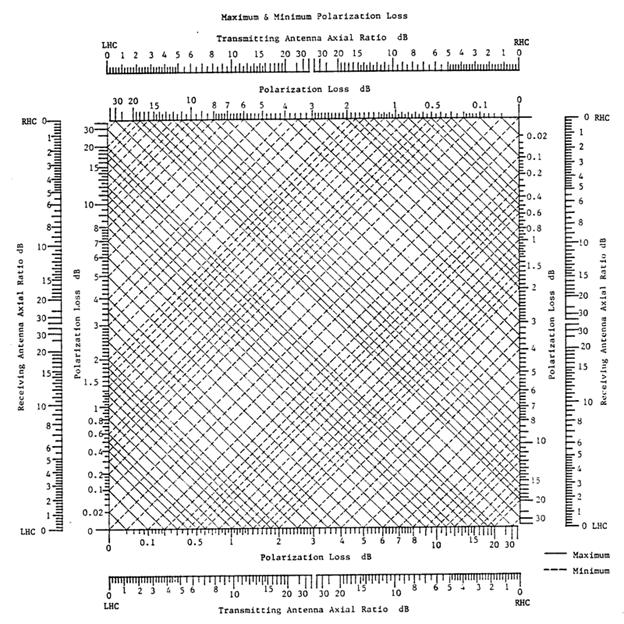
Ludwig Chart
The chart gives the maximum and minimum polarization loss between a transmitting and receiving antenna. All cross polarization is predominately right or left hand circularly polarized. Draw a vertical line between the two transmitting antenna axial ratio scales including polarization sense. Note the so called X-pol. level is numerically equal to axial ratio. Draw a second line between the two receiving polarization scales (right and left). Where the two lines intersect, trace diagonally to read the maximum and minimum polarization losses.